Q1 2019: See what's happening in the Marin County Real Estate Market
As in most of the Bay Area, first quarter housing market activity in Marin remained challenging, leading to fewer overall sales compared to last year. However, most of the decline in sales came from homes priced above $3 million, while lower priced homes fared relatively better than in most of the other Bay Area regions.
Meanwhile, the inventory of homes for sale continued to increase compared to a year ago, albeit at a lower pace than in some other regions. Homes priced above $3 million saw a relatively larger increase in inventory than lower priced homes.
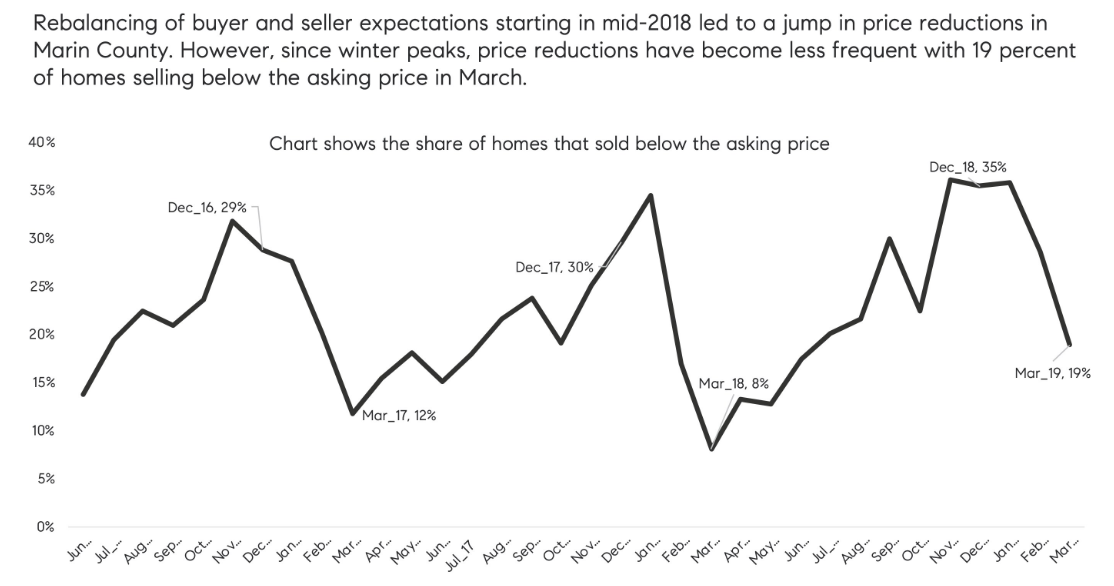
Buyers remain trepid amid the economic and political uncertainties that characterized the first quarter, taking longer to make a decision and seeking price reductions. However, while the price reductions are elevated compared to the year before, they have declined since winter peaks. Most of the homes sold below asking price were higher priced homes. As a result, median price growth stalled in the first quarter.
Looking Forward: Following a challenging beginning to the year, spring home buying season offers improved opportunities for buyers, including lower mortgage rates, more inventory, and improved balance between buyers and sellers already leading to more optimistic buyer sentiment than in recent months.
WATCH THE VIDEO:
Home Prices
Up 1% since Q1 2018
Inventory
Up 18.9% since Q1 2018
Days on Market
70 on average for listings sold this quarter
Sales prices
100.25% of asking prices listed this quarter
THE MEDIAN HOME
The Compass Q1 sale closest to the Marin County median price of $1,294,500
28 Bayharbor Way, San Rafael, CA 94901
3 BD | 3 BA | 1,936 SF
Sale price:
$1,300,000
THE HIGH END
The most expensive home sold in Marin County by Compass in Q4
54 Lower Crescent Avenue, Sausalito, CA 94965
5 BD | 7 BA | 5,838 SF
Sale price:
$5,300,000
Market Statistic of Note
Data provided by local MLS. Information deemed reliable, but not guaranteed.
Defining Marin County: Our real estate markets in Marin County include the cities of Belvedere, Corte Madera, Fairfax, Greenbrae, Kentfield, Larkspur, Mill Valley, Novato, Ross, San Anselmo, San Rafael, Sausalito, and Tiburon. Sales data in the charts includes single-family homes in these communities.


